What are the national consumption footprints? I How are footprints used to contribute to a sustainable bioeconomy? I What are the limitations? I Key footprint results
What are national consumption footprints?
There are strong linkages of the German bioeconomy with other world regions through the trade of biogenic raw materials, intermediate and final products. For example, German agriculture produces food for export while importing significant amounts of animal feed.
Environmental footprints are indicators for measuring the use of natural resources (e.g. occupation of agricultural and forested land as well as water for irrigation) and environmental impacts (e.g. greenhouse gas emissions, loss of soil fertility and biodiversity) domestically and abroad related to the consumption of bio-based goods in Germany [1].
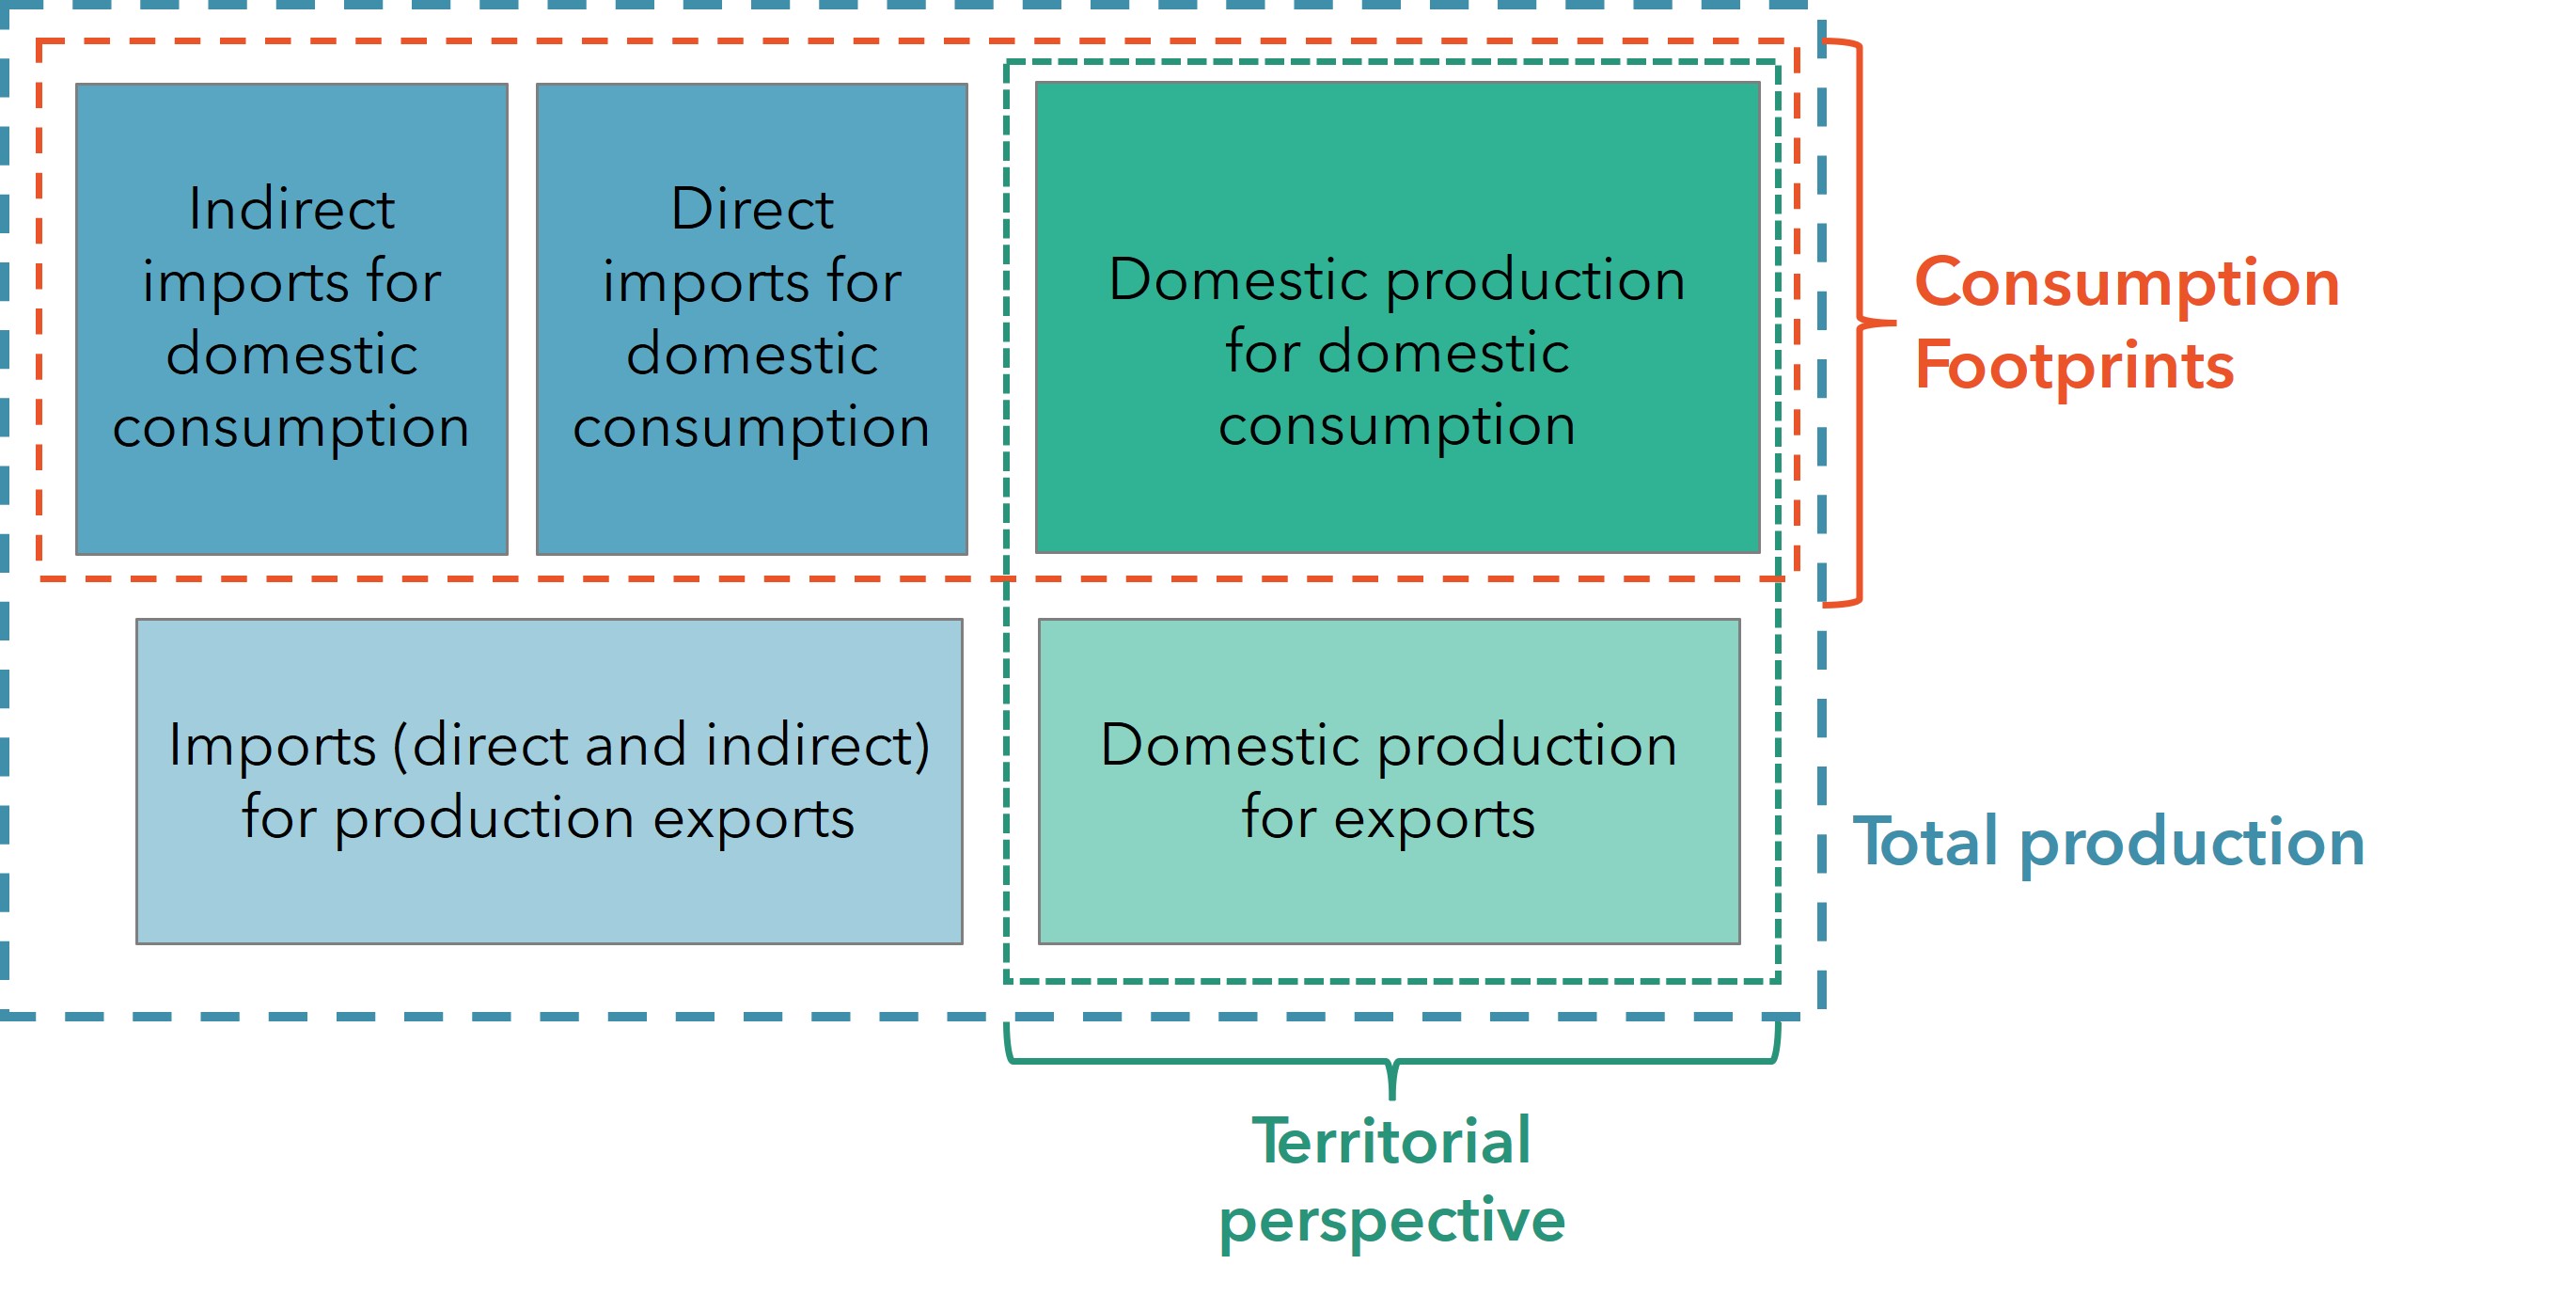
To calculate the consumption footprint of e.g. materials, the total imports (direct and indirect [2]) are added to the domestic production and the total exports (direct and indirect) are subtracted from this sum. Using this data, one can also calculate the material use of total production (the whole German bioeconomy), or apply a territorial perspective and address domestic production only, independent of its use.

Definition of the consumption footprint in relation to the whole German Bioeconomy (Source: adapted from Giljum et al. (2013) [3]).
How are footprints used to contribute to a sustainable bioeconomy?
Environmental footprints play an important role for measuring and monitoring different aspects of sustainability of the bioeconomy at the national level. Footprints help to uncover environmental impacts of German consumption that are “hidden” by global trade and the spatial distance to the point of production. Also, the level of resource use and environmental impacts related to consumption can be estimated and compared between countries on a per capita basis.
The SYMOBIO 1.0 project accounted for the material footprint, agricultural land footprint, forest footprint, water footprint and climate footprint. Additional footprints include e.g. the biodiversity footprint and soil footprint. Each has linkages to the SDGs [4]. For example, the agricultural land footprint has a direct relation to SDG 15 (“Life on land”) as it accounts for potential impacts of agricultural activities on the extent and loss of natural land. To assess how a footprint value relates to sustainability, they must be related to a benchmark [5]. In this context, a number of scientific articles derive premises for sustainable development and discuss aspects such as global distributive justice of resource use and fairness towards future generations as possible starting points to defining targets [6].
What are the limitations?
Up to now, there is no political consensus, neither in Germany nor at the international level, on the aforementioned target values. This makes evaluating sustainability a challenge (i.e. what is a safe and fair consumption level of global agricultural land?). Methodological and data challenges add uncertainty. For example, there are large differences between available datasets to quantify biomass trade between regions [7]. In contrast to e.g. Life Cycle Assessment (LCA), there are only norms and not binding standards that define how footprint indicators are calculated. The variability in datasets and the lack of binding standards make it considerably more difficult to compare the results from different studies. However, the availability of reliable and robust data is increasing (see also Input-Output Analysis).
Key footprint results
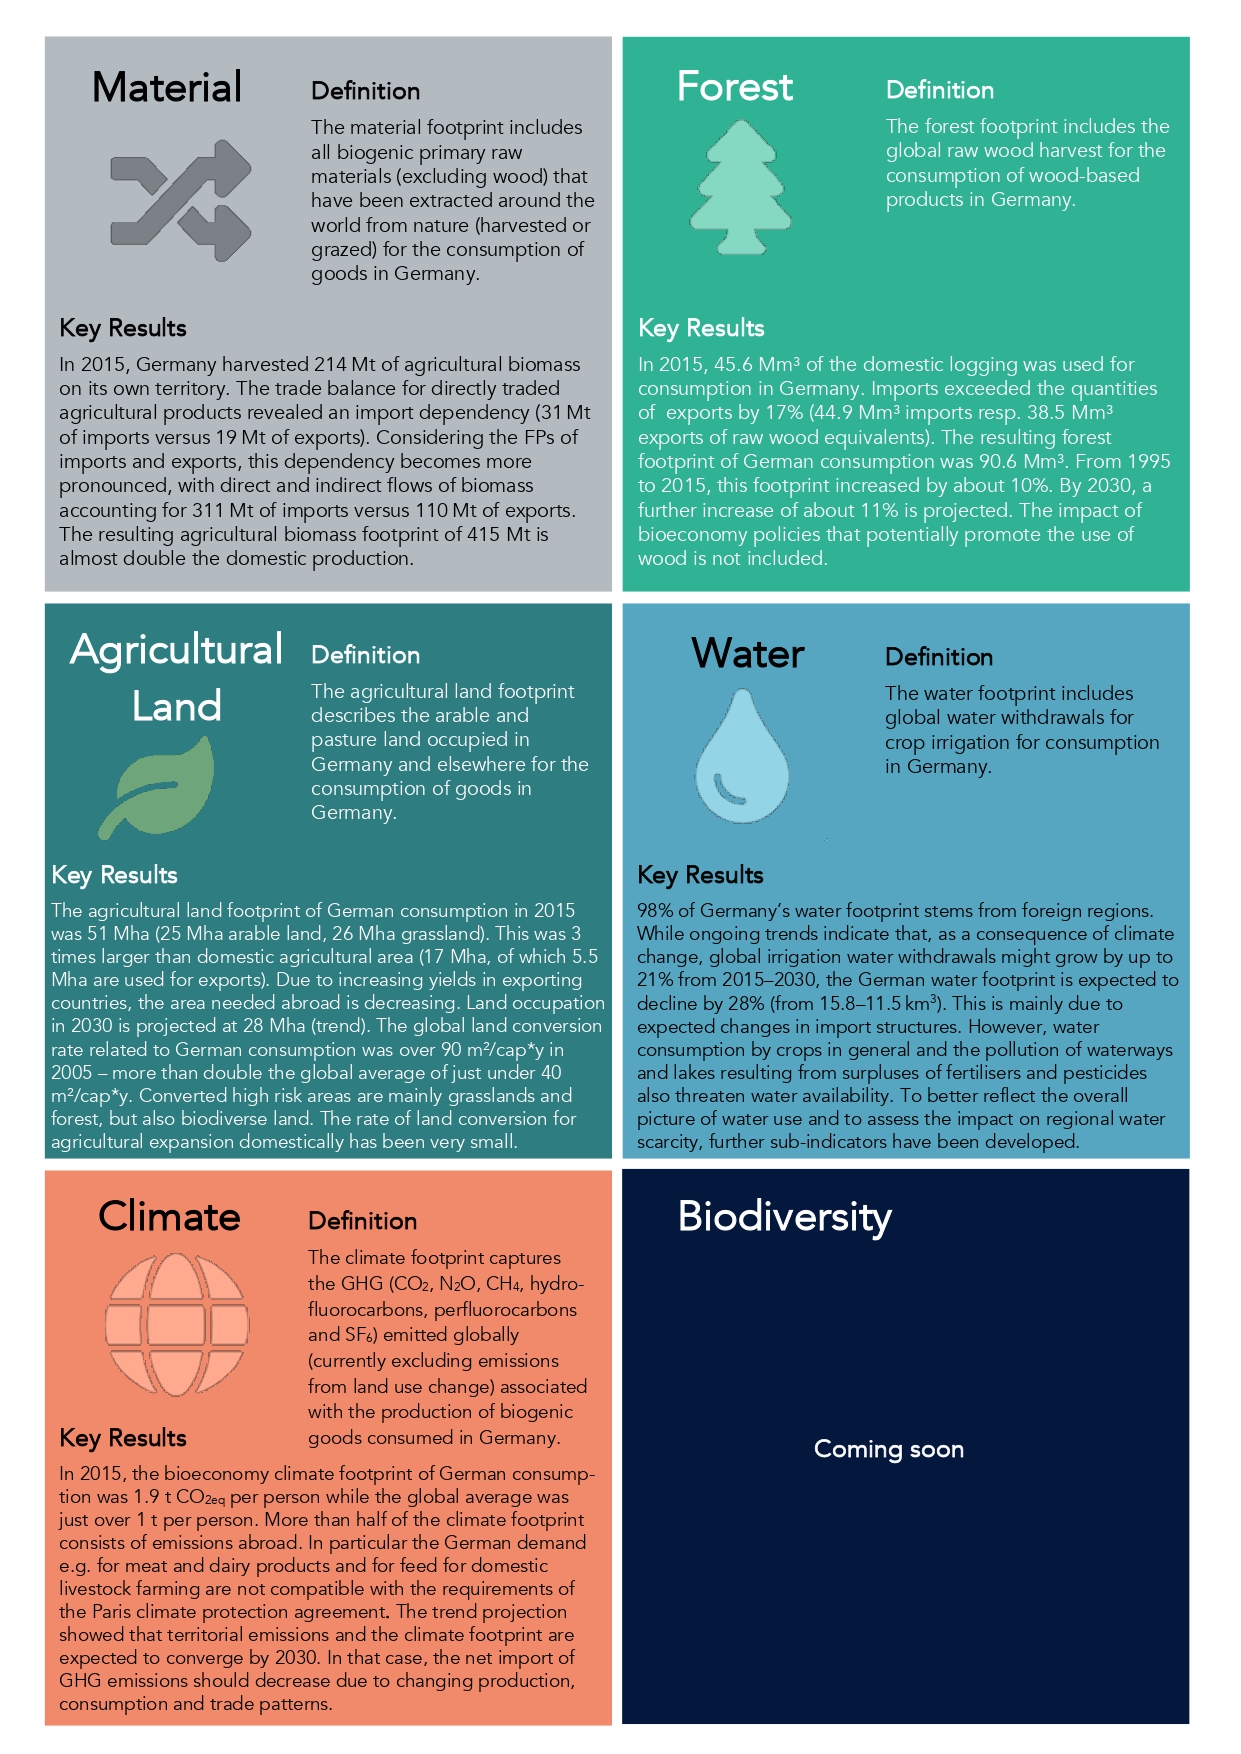
The project SYMOBIO developed a model system that integrates a Multi-Regional Input-Output model with a global land use model [8] and other economic and environmental models [4]. First results were published in the "Pilot Report on the Monitoring of the German Bioeconomy" [9]. In addition, an interactive web-based application SYMOBIO Data Explorer enables users to further explore and visualize the data underlying that report for five footprints. As the environmental impacts of the production of bio-based products for exports should not be neglected in a comprehensive monitoring framework, this perspective is additionally included. The footprints were calculated for the historical period 1995 – 2015 and as a trend analysis until the year 2030 [4].

Dashboard of National Consumption Footprints. (Sources: Based on Bringezu et al. (2021) [4] [9] and Schomberg et al. (2022) [10]).
Note: Pojections are based on modeling historical trends using the GINFORS model, as presented in Bringezu et al. (2021) [4]
Read more about agriculture and crop use and forests and wood use.
Notes and references
- Tukker et al. (2016). Environmental and resource footprints in a global context: Europe’s structural deficit in resource endowments. Environ. Chang. doi: 10.1016/j.gloenvcha.2016.07.002; Verones et al. (2017). Resource footprints and their ecosystem consequences. Scient. report. doi: 10.1038/srep40743
- The sum of direct and indirect material imports or exports are often referred to as the “Raw Material Equivalents” (RME) and are the total amount of biomass being harvested or grazed to produce the traded product. The agricultural land use footprint of the product is the area of land used to produce this biomass quantity.
- Giljum et al. (2013). State-of-play of national consumption-based indicators. A review and evaluation of available methods and data to calculate footprint-type (consumption-based) indicators for materials, water, land and carbon. Sustainable Europe Research Institute (SERI). Available at: http://ec.europa.eu/environment/enveco/resource_efficiency/pdf/FootRev_Report.pdf
- Bringezu et al. (2021): Environmental and socioeconomic footprints of the German bioeconomy. Nat. Sustain. Available at: doi: 10.1038/s41893-021-00725-3.
- A concept for how this can be done at different scales is presented in Egenolf and Bringezu (2019). Conceptualization of an Indicator System for Assessing the Sustainability of the Bioeconomy. doi: 10.3390/su11020443
- O’Neill et al. (2018). A good life for all within planetary boundaries. Sustain. doi: 10.1038/s41893-018-0021-4; Häyhä et al. (2016). From Planetary Boundaries to national fair shares of the global safe operating space - How can the scales be bridged? Glob. Environm. Chang. doi: 10.1016/j.gloenvcha.2016.06.008
- Bruckner et al. (2015). Measuring telecouplings in the global land system: A review and comparative evaluation of land footprint accounting methods. Econ. doi: 10.1016/j.ecolecon.2015.03.008; Inomata and Owen (2014). Comparative evaluation of MRIO databases. Econ. Syst. Res. doi: 10.1080/09535314.2014.940856
- The landuse model LandSHIFT models the global landuse and land conversion over space and time. Schaldach et al. (2011). An integrated approach to modelling land-use change on continental and global scales, Env. Modelling & Software. Available at: doi: 10.1016/j.envsoft.2011.02.013.
- Bringezu et al. (2021). Pilot report on the monitoring of the German bioeconomy. doi: 10.17170/kobra-202201115406
- Schomberg et al. (2022). Spatially explicit life cycle assessments reveal hotspots of environmental impacts from renewable electricity generation. Earth Environ. 3. Available at: doi: 10.1038/s43247-022-00521-7


